Flood Detection and Historical Analysis (2019–2024) of Chaundhar River Area
Introduction
Flooding is a recurrent natural disaster in Nepal, especially during the monsoon season (July to August). This study focuses on the Chaundhar River area in Kanchanpur District, one of the flood-prone zones in the far-western region of Nepal. Using remote sensing and cloud-based geospatial analytics, we aim to estimate the spatial extent of flooding over a six-year period (2019–2024).
The results help in understanding temporal flood patterns, planning for infrastructure resilience, and informing local disaster management policies.
Study Area Description
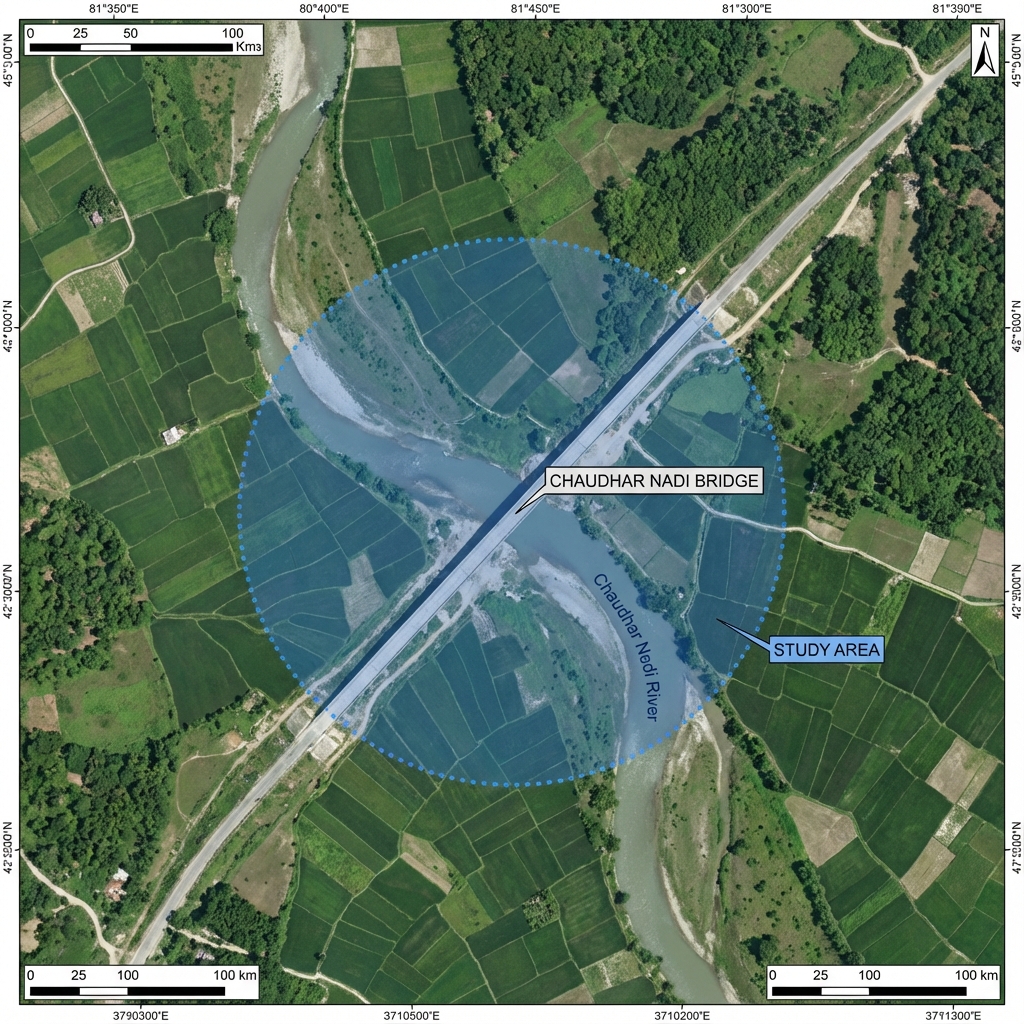
- Location of Interest: Chaudhar Nadi Bridge, near Naya Gaun, Kanchanpur
- Coordinates: Latitude 28.929506, Longitude 80.260664
- Area of Interest (AOI): A circular buffer with a 2.5 km radius centered on the bridge
- AOI Size: Approximately 19.6 square kilometers
The AOI was selected based on its relevance to transportation infrastructure and flood vulnerability. A 2.5 km buffer provides sufficient spatial coverage for detecting flood spread in the surrounding catchment.
Data Sources and Tools
- Satellite Dataset: Sentinel-1 Synthetic Aperture Radar (SAR)
- Collection:
COPERNICUS/S1_GRD - Polarization: VV (Vertical transmit and receive)
- Mode: IW (Interferometric Wide Swath)
- Platform: Google Earth Engine (GEE) Python API
Methodology and Algorithm
1. Weekly Date Range Generation
We defined weekly intervals from July 1 to August 31 for each year from 2019 to 2024. This generated a consistent monitoring schedule across six monsoon seasons.
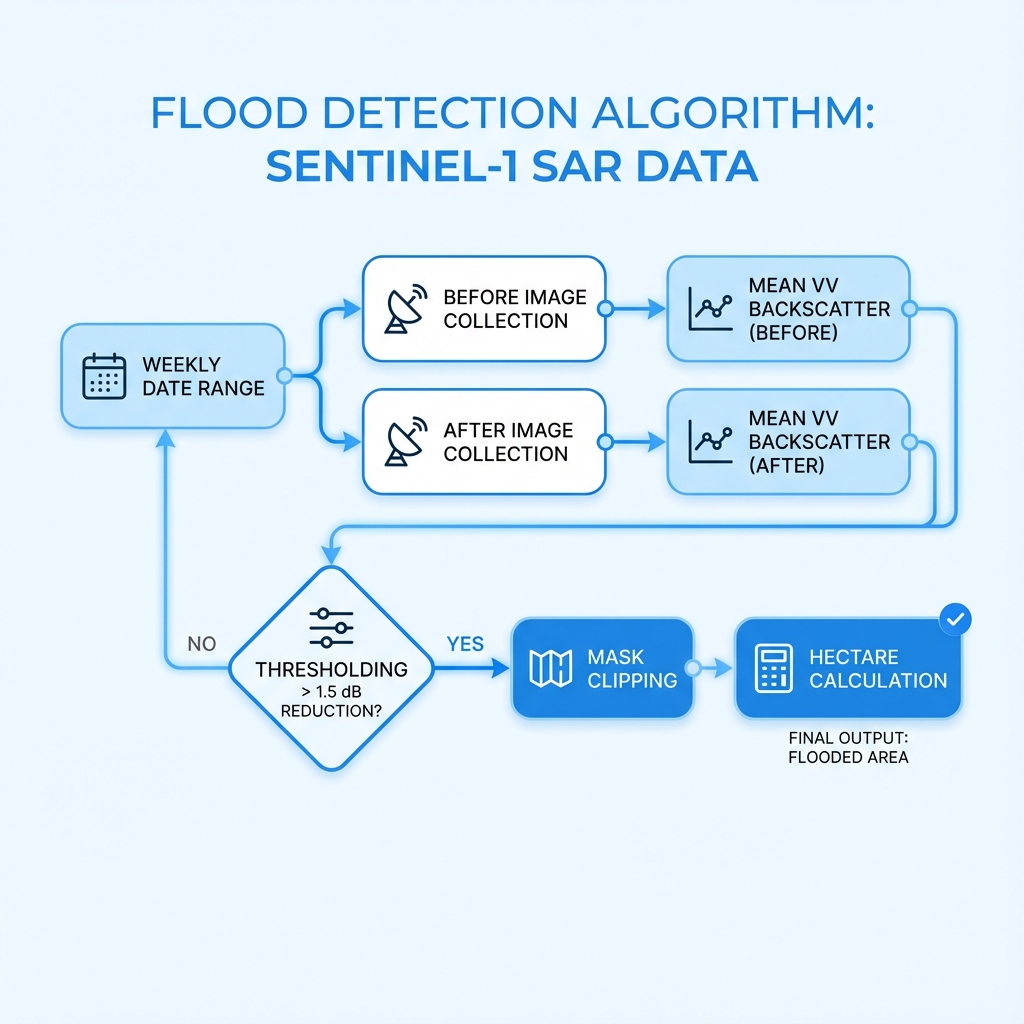
2. Flood Detection Algorithm
For each weekly time window:
- Before Image Collection: Sentinel-1 images captured 6 days before the week.
- After Image Collection: Sentinel-1 images captured during and 1 day after the week.
Processing Steps:
- Compute the mean VV backscatter for both before and after collections.
- Subtract the "after" image from the "before" image to identify reductions in backscatter.
- Apply a threshold (greater than 1.5 dB reduction) to highlight potentially flooded areas.
- Mask non-flooded regions and clip the flood mask to the AOI.
- Convert valid flood pixels to hectares using the pixel area.
- Summarize the flood extent for each week.
Results
The script outputs a file named Chaudhar_River_Flood_History_2019_2024.csv with the weekly flood-affected area in hectares (ha). This longitudinal data allows for deep historical analysis of flood intensity and frequency.
"Understanding the past is key to protecting the future."
The analysis shows significant variations in flood extent across the years, highlighting the increasing importance of robust disaster management strategies in the region.